Case Study · 3D Systems · 2016–2019
The economic build-out analysis that ended a product line
The problem
The Cube and CubePro were 3D Systems' bid to capture the desktop-3D-printer wave of the mid-2010s. When management confronted the lines' future, the question wasn't sentiment — it was quantitative: at every possible build-out quantity, what does it cost to scrap the remaining component inventory, what does it cost to procure what's still missing, and what does the labor bill look like?
Nobody asked for this
Leadership was circling the decision without analytics solid enough to anchor it. I went to my director and said I thought the question could be modeled properly — component by component, across the full range of build quantities — and asked for the room to do it. The analysis existed because the gap was visible and someone offered to close it, not because it appeared on a work plan.
There was no method to inherit. Nobody at the company had framed a wind-down this way, so the approach had to be designed from scratch alongside the model itself.
The model
I modeled the full decision space at component level, from the bill of materials down. Three cost functions move against each other as build quantity rises: cost-to-scrap falls (more inventory gets consumed), while cost-to-procure and labor climb. Their sum is a U-shaped curve — and the bottom of that curve is the answer.
Most of the difficulty sat upstream of that math. A trustworthy picture meant pulling component-level inventory positions and open purchase-order commitments out of the ERP, which took knowing the reporting layer well enough to get numbers that actually reconciled — then squaring them against inventory valuation and what we were already contractually on the hook for. Scrap cost isn't just what sits on the shelf; it includes material still inbound against commitments that couldn't simply be cancelled.
Labor was its own problem. A build-out cost per unit that would survive scrutiny had to come from the people who would actually do the building, so I worked it out with the operations team rather than assuming a rate. The whole thing came together as an Excel model built from the BOM up.
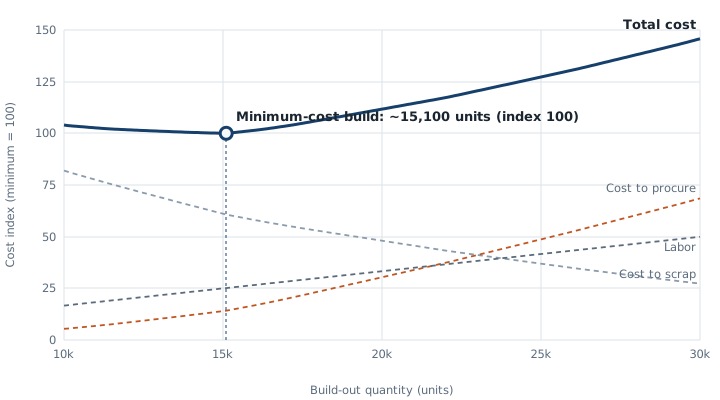
Reconstructed illustration based on the original approach; values indexed to the minimum-cost option (100) across a 10,000–30,000-unit decision space.
The result
The curve bottomed out at roughly 15,100 units — building less meant scrapping too much paid-for inventory; building more meant buying and assembling components for demand that wasn't coming. Versus the extremes of the range analyzed, the optimum avoided cost differences of roughly 4% on the low end and more than 45% on the high end.
I presented the model and the curve to my director and VP, who carried it forward from there. It became the major factor in the decision to end-of-life both product lines.
Ending a product line is the kind of decision people postpone, because sentiment and sunk cost both argue for one more quarter. What the model provided wasn't a new opinion — it was a number that made the cost of postponing visible. Sometimes the most valuable thing a cost model does is make an uncomfortable decision undeniable.