Case Study · 3D Systems · 2016–2019
The MRP dashboard that cut part shortages 95%
The problem
Buyers found out about part shortages the worst possible way: when production did. The MRP system knew the demand, the inventory system knew the supply, and open purchase orders knew what was coming — but no one could see all three, per part, per week, in one place. By the time a shortage surfaced, the lead time to fix it had often already passed.
What I built
A dashboard projecting net-available inventory for every purchased component, week by week, 52 weeks out — netting on-hand inventory, open sales orders, the production schedule, and inbound purchase orders, per production line. Fed by data pulls I built directly against our Oracle reporting layer, refreshed on a cycle, and deployed across both the US factory and its counterpart in Belgium.
The feature that changed behavior was the lead-time shadow: each part's projection is split at its replenishment lead time. A projected shortage inside the shadow is still fixable — place the order now and it lands in time. Beyond it, the shortage is locked in. That single distinction converted a wall of numbers into a daily priority list.
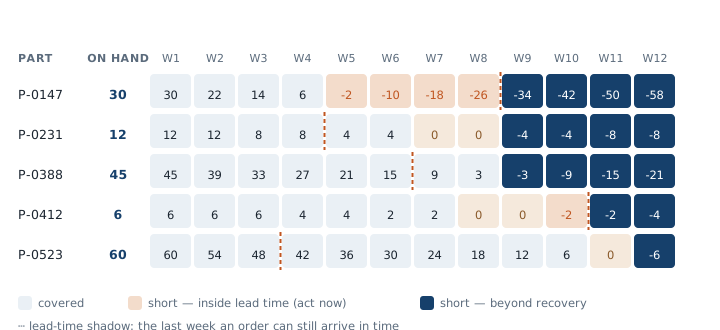
Stylized illustration; part numbers fictional. The real dashboard covered every purchased component across multiple production lines, 52 weeks deep.
The result
Part shortages fell roughly 95% for the 10-buyer team. Not because anyone worked harder — because every buyer could finally see, at a glance, exactly which parts were late, not yet ordered, surplus, or excess, and which shortages could still be prevented this week. The dashboard turned expediting from a firefight into a checklist.
Owning it also meant owning the engine underneath: I held the weekly task of recalibrating MRP itself against prior-week actuals and forecast updates, keeping the projections honest.